本文在飞书文档完成,所以导出为md格式有一些排版问题,另附PDF文件,建议阅读PDF文件。
Java 火焰图探索
问题
在上一周,我们尝试生成了一些火焰图,这里以 crypto.rsa 为例,开始探索分析 Java 火焰图的生成方案。
下图是直接通过 perf 和 FlameGraph 生成的 crypto.rsa 用例火焰图,运行时没有特殊的选项。
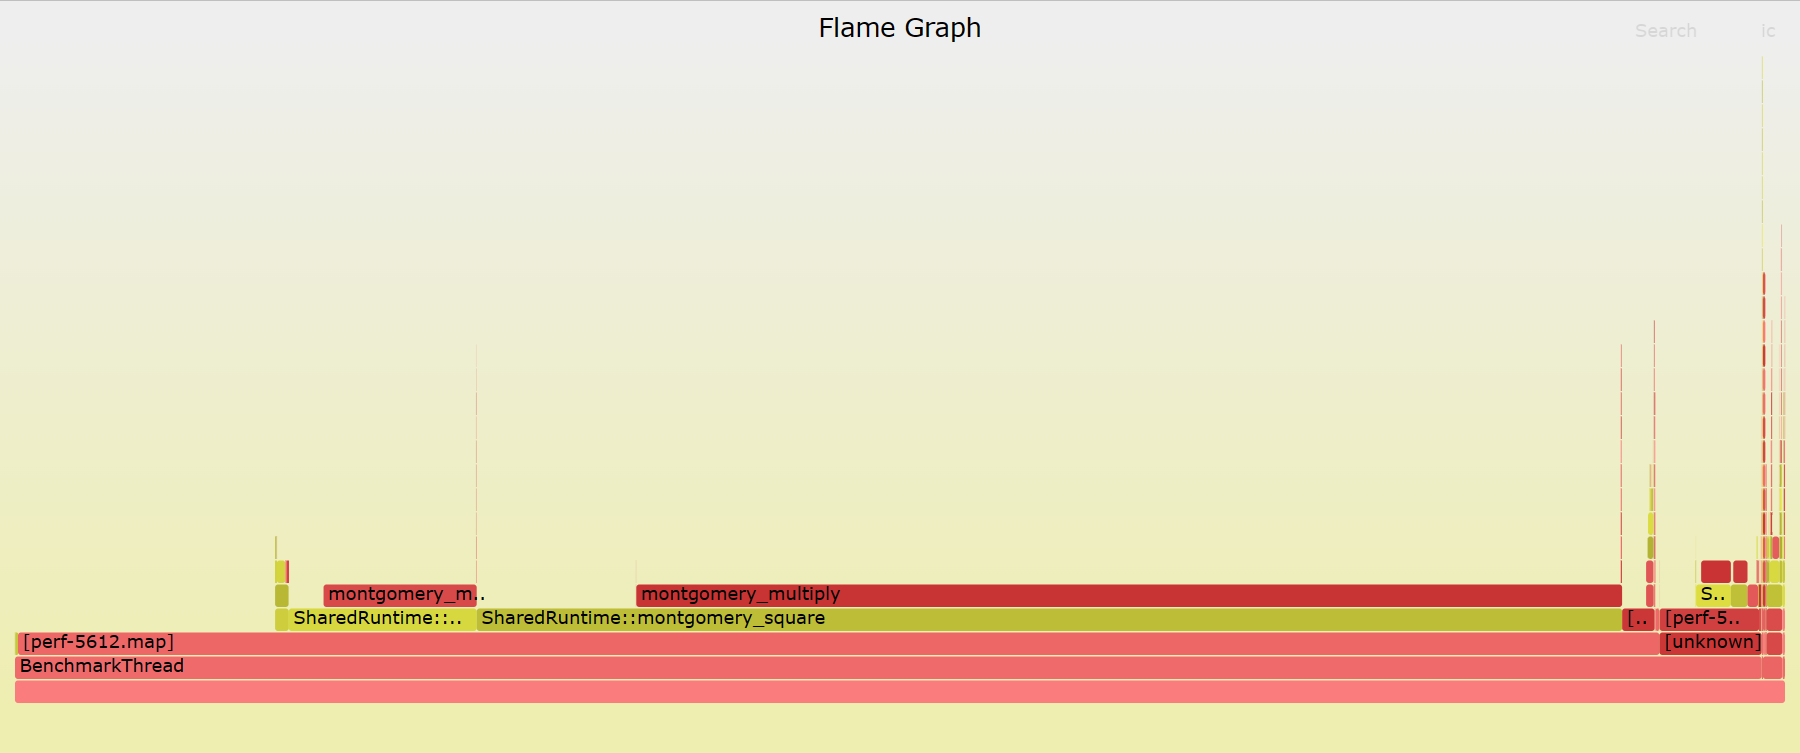
可以看到,直接通过 perf 等工具生成的火焰图只显示内核函数的调用栈,并不显示 Java 的调用栈(stack)和方法(method),那么如何通过火焰图分析 Java 程序的性能呢?那么为什么会产生这些问题?
究竟是什么原因导致无法显示 method 以及完整的 stack 呢?
参考 https://netflixtechblog.com/java-in-flames-e763b3d32166 这篇文章:
- 为什么 stack 不完整 原因在于在 x86 上,JVM 使用 frame pointer register on x86 (RBP on x86–64)作为通用的寄存器,打破了传统的堆栈遍历。
- 为什么不显示 method 原因在于 JVM 使用 JIT,并且 JIT 没有暴露出一个 symbol table,导致工具无法获取具体的 method。
Fixing Frame Pointers
可行的方法(参考 https://www.brendangregg.com/Slides/KernelRecipes_Perf_Events.pdf)
- 修复基于帧指针的 stack walker
– 优点:简单,支持任何系统
– 缺点:会增加一些 CPU 开销
- perf record -g dwarf
– 优点:更丰富的调试信息
– 缺点:不支持较老的内核,会增加生成数据的大小
- 应用程序支持:
在 Java 中,我们可以使用 -XX:+PreserveFramePointer 控制显示完整的 stack(可以参考以下记录:在 JKD8 中为 https://bugs.openjdk.org/browse/JDK-8072465,JDK9 中为 https://bugs.openjdk.org/browse/JDK-8068945)。不过,PreserveFramePointer 只在 JDK 8u60+ 后可以使用,并且带来额外的性能损失(0~3%)
这是我们通过添加该选项后生成的火焰图:
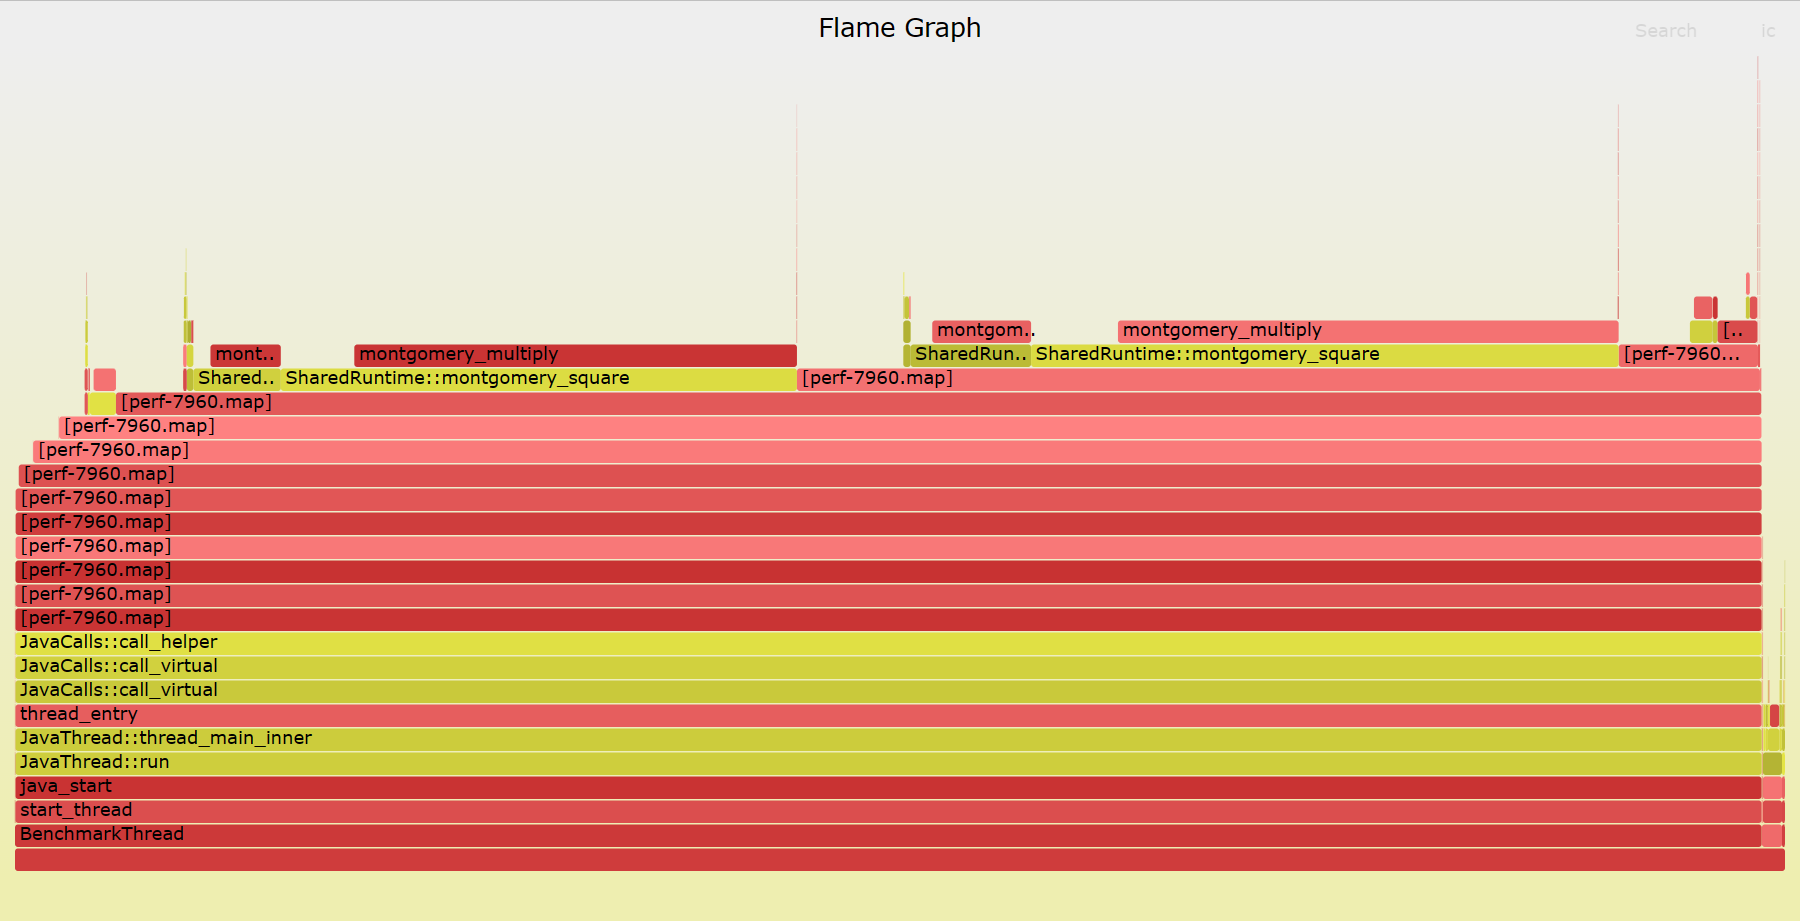
可以看到,程序的调用栈确实深了很多,但是都是一些无意义的 perf-$(pid).map,那么如何解决这个问题?这就引出了我们此前提到的 JIT 没有暴露出一个 symbol table,导致工具无法获取地址对应的方法名称
Fixing Symbols
perf 此前添加了 JIT symbols 支持(https://lkml.org/lkml/2009/6/8/499),从而支持如 Java、Node.js 等程序的符号。Perf 会默认要查找映射文件 perf-$(pid).map。该文件列出符号地址、大小和符号名称。如果我们能够生成Java程序对应的perf-$(pid).map,就能够正确的显示方法名称。
其中,部分代码如下:
perf\util\symbol.c
- 查找 perf-
.map
/* Checks for the existence of the perf-<pid>.map file in two different
 * locations.  First, if the process is a separate mount namespace, check in
 * that namespace using the pid of the innermost pid namespace.  If's not in a
 * namespace, or the file can't be found there, try in the mount namespace of
 * the tracing process using our view of its pid.
 *
 * 先在进程自己的命名空间查找 perf 映射文件 → 如果没有,在跟踪进程的命名空间查找 → 如果两个地方都没有,返回文件不存在;如果任一地方找到,返回文件存在。
 */
static int dso__find_perf_map(char *filebuf, size_t bufsz,
                            struct nsinfo **nsip)
{
        struct nscookie nsc;
        struct nsinfo *nsi;
        struct nsinfo *nnsi;
        int rc = -1;

        nsi = *nsip;
        // 检查是否需要设置命名空间
        if (nsinfo__need_setns(nsi)) {
               snprintf(filebuf, bufsz, "/tmp/perf-%d.map", nsinfo__nstgid(nsi));
               nsinfo__mountns_enter(nsi, &nsc);
               rc = access(filebuf, R_OK);
               nsinfo__mountns_exit(&nsc);
               if (rc == 0)
                      return rc;
        }
        // 复制当前的命名空间信息到新的命名空间信息结构体
        nnsi = nsinfo__copy(nsi);
        if (nnsi) {
               nsinfo__put(nsi);// 释放原始命名空间信息
               // 清除新命名空间信息结构体中的need_setns标志
               nsinfo__clear_need_setns(nnsi);
               snprintf(filebuf, bufsz, "/tmp/perf-%d.map", nsinfo__tgid(nnsi));
               *nsip = nnsi;
               rc = 0;
        }

        return rc;
}
- 读取 perf-
.map
static int dso__load_perf_map(const char *map_path, struct dso *dso)
{
        char *line = NULL;        // 读取每行的缓冲区
        size_t n;                 // 缓冲区大小
        FILE *file;               // 文件指针
        int nr_syms = 0;          // 符号计数器,默认为0

        file = fopen(map_path, "r");
        if (file == NULL)
               goto out_failure;

        while (!feof(file)) {
               u64 start, size; // 起始地址和大小
               struct symbol *sym; // 符号结构指针
               int line_len, len;// 行长度和长度

               line_len = getline(&line, &n, file);
               if (line_len < 0)
                      break;

               if (!line)
                      goto out_failure; // 行为空,跳到失败处

               line[--line_len] = '\0'; /* \n */  // 去掉换行符

               len = hex2u64(line, &start);// 转换起始地址

               len++;
               if (len + 2 >= line_len)
                      continue;// 如果长度超出行长度或接近行尾,则继续下一次循环

               len += hex2u64(line + len, &size);// 转换大小

               len++;
               if (len + 2 >= line_len)
                      continue;

               sym = symbol__new(start, size, STB_GLOBAL, STT_FUNC, line + len);  // 创建新的符号结构

               if (sym == NULL)
                      goto out_delete_line; // 创建符号结构失败,跳到删除行处

               symbols__insert(&dso->symbols, sym); // 插入符号结构
               nr_syms++; // 符号数量加1
        }

        free(line);
        fclose(file);

        return nr_syms;

out_delete_line:
        free(line);
out_failure:
        return -1;
}
3.1 JVMTI
为了使 perf 能够显示方法名称,我们首先需要收集 Java 程序包含的 symbols,这里我们首先需要了解一下 JVMTI
The JVM(TM) Tool Interface (JVM TI) is a programming interface used by development and monitoring tools. It provides both a way to inspect the state and to control the execution of applications running in the Java(TM) virtual machine (VM). –https://docs.oracle.com/javase/8/docs/platform/jvmti/jvmti.html
简单来说,JVMTI 是一套标准的 C/C++ 编程接口,是实现 Debugger、Profiler、Monitor、Thread Analyser 等工具的统一基础,通过 JVMTI,我们可以设计一款 Java agent,生成目标 Java 进程中被 JIT 编译过的 Java 方法的方法名与生成的机器码的地址映射。
3.2 perf-map-agent
perf-map-agent(https://github.com/jvm-profiling-tools/perf-map-agent)是一款开源的 JVMTI agent,可以生成 JIT 编译过的 Java 方法的方法名与生成的机器码的地址映射。
通过源码我们可以分析 perf-map-agent 的原理,下面源码的注释部分参考 https://blog.csdn.net/qq_31865983/article/details/110431742,我添加注释后的项目见 https://github.com/icyclv/perf-map-agent。
项目主要包含包含两部分内容,一个是用 C 写的 agent,负责生成映射文件,一个是 Java 写的 jar 包,负责将 C 写的 agent attach 到 Java 进程上。
AttachOnce.java
Java 程序只要负责将后面介绍的 agent attach 到 Java 进程上
public class AttachOnce {
    public static void main(String[] args) throws Exception {
        String pid = args[0];
        String options = "";
        if (args.length > 1) options = args[1];
        loadAgent(pid, options);
    }

    static void loadAgent(String pid, String options) throws Exception {
        // attach到目标进程
        VirtualMachine vm = VirtualMachine.attach(pid);
        try {
            final File lib;
            if (System.getProperty("os.name", "").toLowerCase(Locale.US).contains("os x")) {
                lib = new File("libperfmap.dylib");
            } else {
                lib = new File("libperfmap.so");
            }
            String fullPath = lib.getAbsolutePath();
            if (!lib.exists()) {
                System.out.printf("Expected %s at '%s' but it didn't exist.\n", lib.getName(), fullPath);
                System.exit(1);
            }
            // 加载agent
            else vm.loadAgentPath(fullPath, options);
        } catch(com.sun.tools.attach.AgentInitializationException e) {
            // rethrow all but the expected exception
            if (!e.getMessage().equals("Agent_OnAttach failed")) throw e;
        } finally {
            vm.detach();
        }
    }
}
perf-map-agent.c
该 agent 的核心方法为 Agent_OnAttach,主要配置了相关事件的回调函数,主要流程如下:
JNIEXPORT jint JNICALL
Agent_OnAttach(JavaVM *vm, char *options, void *reserved) {
    open_map_file(); // 创建perf-$pid.map文件
    // 参数初始化
    unfold_simple = strstr(options, "unfoldsimple") != NULL;
    unfold_all = strstr(options, "unfoldall") != NULL;
    unfold_inlined_methods = strstr(options, "unfold") != NULL || unfold_simple || unfold_all;
    print_method_signatures = strstr(options, "msig") != NULL;
    print_source_loc = strstr(options, "sourcepos") != NULL;
    dotted_class_names = strstr(options, "dottedclass") != NULL;
    clean_class_names = strstr(options, "cleanclass") != NULL;
    annotate_java_frames = strstr(options, "annotate_java_frames") != NULL;

    bool use_semicolon_unfold_delimiter = strstr(options, "use_semicolon_unfold_delimiter") != NULL;
    unfold_delimiter = use_semicolon_unfold_delimiter ? ";" : "->";

    debug_dump_unfold_entries = strstr(options, "debug_dump_unfold_entries") != NULL;
    // 定义并获取jvmtiEnv
    jvmtiEnv *jvmti;
    (*vm)->GetEnv(vm, (void **)&jvmti, JVMTI_VERSION_1);
    // 注册JVM TI 的Capabilities
    enable_capabilities(jvmti);
    // 注册JVM TI 的回调函数(CompiledMethodLoad  和 DynamicCodeGenerated )
    set_callbacks(jvmti);
    // 设置通知模式,开启CompiledMethodLoad和DynamicCodeGenerated通知
    set_notification_mode(jvmti, JVMTI_ENABLE);
    // 生成事件,因为是在目标程序执行开始后才开始附加代理
    // 一些事件已经被触发过了,因此这里重新触发一次,防止错过事件
    // 例如:`JVMTI_EVENT_COMPILED_METHOD_LOAD`,会为每个当前编译的方法发送一个`CompiledMethodLoad`事件,不过之前加载但现已卸载的方法不会发送。
    // 每次调用此函数时,所有当前编译的方法都将被发送。
    (*jvmti)->GenerateEvents(jvmti, JVMTI_EVENT_DYNAMIC_CODE_GENERATED);
    (*jvmti)->GenerateEvents(jvmti, JVMTI_EVENT_COMPILED_METHOD_LOAD);
    set_notification_mode(jvmti, JVMTI_DISABLE);
    close_map_file();

    return 0;
perf-map-agent 主要关注两类事件
- CompiledMethodLoad :Java 方法被 JIT 编译器编译完成的事件。当方法被编译时,会发送此事件通知 agent。
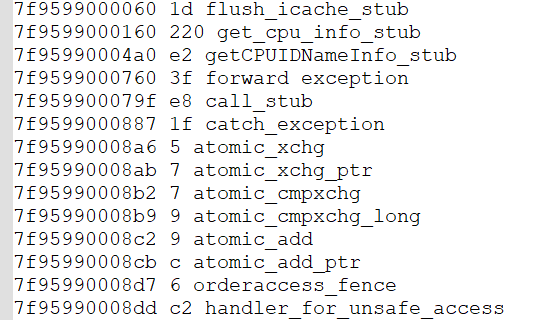
- DynamicCodeGenerated :当 VM 的某个组件动态生成时会发送此事件。比如 Interpreter、call_stub、flush_icache_stub 等等
他们的区别可以参考 https://stackoverflow.com/questions/64321066/what-is-diff-between-jvmti-event-compiled-method-and-jvmti-event-dynamic-code,具体的文档可以参考 https://docs.oracle.com/javase/8/docs/platform/jvmti/jvmti.html#GenerateEvents
其中,Agent_OnAttach 中调用的部分方法如下:
jvmtiError enable_capabilities(jvmtiEnv *jvmti) {
    jvmtiCapabilities capabilities;

    memset(&capabilities,0, sizeof(capabilities));
    // 可以为每个加载的类生成 ClassFileLoadHook 事件。
    capabilities.can_generate_all_class_hook_events  = 1;
    // 启用对象标记功能
    capabilities.can_tag_objects                     = 1;
    // 启用对象释放事件生成功能
    capabilities.can_generate_object_free_events     = 1;
    // 启用获取源文件名功能
    capabilities.can_get_source_file_name            = 1;
    // 启用获取行号功能
    capabilities.can_get_line_numbers                = 1;
    // 启用VM对象分配事件生成功能
    capabilities.can_generate_vm_object_alloc_events = 1;
    // 启用编译方法加载事件生成功能
    capabilities.can_generate_compiled_method_load_events = 1;

    return (*jvmti)->AddCapabilities(jvmti, &capabilities);
}

jvmtiError set_callbacks(jvmtiEnv *jvmti) {
    //设置回调函数
    jvmtiEventCallbacks callbacks;

    memset(&callbacks, 0, sizeof(callbacks));
    // CompiledMethodLoad  :Java方法被JIT编译器编译的事件。当方法被编译时,会发送此事件通知agent。
    // DynamicCodeGenerated :当VM的某个组件动态生成代码时会发送此事件。也就是一个本地方法根据命令行参数被动态编译完成后触发的事件。
    //                                     Interpreter也属于此类。 参考:https://stackoverflow.com/questions/64321066/what-is-diff-between-jvmti-event-compiled-method-and-jvmti-event-dynamic-code

    callbacks.CompiledMethodLoad  = &cbCompiledMethodLoad;
    callbacks.DynamicCodeGenerated = &cbDynamicCodeGenerated;
    return (*jvmti)->SetEventCallbacks(jvmti, &callbacks, (jint)sizeof(callbacks));
}


void set_notification_mode(jvmtiEnv *jvmti, jvmtiEventMode mode) {
    (*jvmti)->SetEventNotificationMode(jvmti, mode, JVMTI_EVENT_COMPILED_METHOD_LOAD, (jthread)NULL);
    (*jvmti)->SetEventNotificationMode(jvmti, mode, JVMTI_EVENT_DYNAMIC_CODE_GENERATED, (jthread)NULL);
}
我们需要关注的重点是设置的回调函数中的内容,其两个事件的代码如下:
void JNICALL
cbDynamicCodeGenerated(jvmtiEnv *jvmti,
            const char* name,
            const void* address,
            jint length) {
    perf_map_write_entry(method_file, address, (unsigned int) length, name);
}

static void JNICALL
cbCompiledMethodLoad(
            jvmtiEnv *jvmti,
            jmethodID method,
            jint code_size,
            const void* code_addr,
            jint map_length,
            const jvmtiAddrLocationMap* map,
            const void* compile_info) {
    // generate_unfolded_entries会把内联优化掉的子方法的方法名同内存地址的映射也写入到映射文件中
    if (unfold_inlined_methods && compile_info != NULL)
        generate_unfolded_entries(jvmti, method, code_size, code_addr, compile_info);
    else
        generate_single_entry(jvmti, method, code_addr, code_size);
}
// 添加一行记录,格式为:code_addr code_size entry
void perf_map_write_entry(FILE *method_file, const void* code_addr, unsigned int code_size, const char* entry) {
    if (method_file)
        fprintf(method_file, "%lx %x %s\n", (unsigned long) code_addr, code_size, entry);
}
其中,DynamicCodeGenerated 的回调函数提供的参数已经包含了我们需要的 code_addr code_size entry,因此直接写入即可。对于 CompiledMethodLoad 中调用默认配置下使用的 generate_single_entry,可以直接获取地址和大小,需要做的是获取方法名等相关信息。
void generate_single_entry(
        jvmtiEnv *jvmti,
        jmethodID method,
        const void *code_addr,
        jint code_size) {
    //生成被JIT编译器编译过的Java方法的方法名同生成的机器码的内存地址的映射,
    // 其主要逻辑是根据jmvtiEnv的方法获取Java方法的方法名,方法签名,所属的类名,源代码文件名和方法的行数等属性,
    // 将这些信息格式化拼装成一个字符串,同编译生成的机器码的内存地址,机器码的大小一同写入文件中。

    char entry[STRING_BUFFER_SIZE];
    // 生成方法名、方法签名、类名、源代码文件名和方法的行数等属性,保存在entry中
    sig_string(jvmti, method, entry, sizeof(entry), frame_annotation(false));
    // 将地址、大小、entry写入perf-<pid>.map文件中
    perf_map_write_entry(method_file, code_addr, (unsigned int) code_size, entry);
}

static void sig_string(jvmtiEnv *jvmti, jmethodID method, char *output, size_t noutput, char *annotation) {
    char *sourcefile = NULL;
    char *method_name = NULL;
    char *msig = NULL;
    char *csig = NULL;
    jvmtiLineNumberEntry *lines = NULL;

    jclass class;
    jint entrycount = 0;

    strncpy(output, "<error writing signature>", noutput);
    // 获取方法名
    if (!(*jvmti)->GetMethodName(jvmti, method, &method_name, &msig, NULL)) {
        // 获取类名和签名
        if (!(*jvmti)->GetMethodDeclaringClass(jvmti, method, &class) &&
            !(*jvmti)->GetClassSignature(jvmti, class, &csig, NULL)) {

            char source_info[1000] = "";
            char *method_signature = "";

            // 如果需要输出文件名、行号
            if (print_source_loc) {
                if (!(*jvmti)->GetSourceFileName(jvmti, class, &sourcefile)) {
                    if (!(*jvmti)->GetLineNumberTable(jvmti, method, &entrycount, &lines)) {
                        int lineno = -1;
                        if(entrycount > 0) lineno = lines[0].line_number;
                        snprintf(source_info, sizeof(source_info), "(%s:%d)", sourcefile, lineno);

                        deallocate(jvmti, lines);
                    }
                    deallocate(jvmti, (unsigned char *) sourcefile);
                }
            }
            // 如果需要输出方法签名
            if (print_method_signatures && msig)
                method_signature = msig;

            char class_name[STRING_BUFFER_SIZE];
            // 格式化类名
            class_name_from_sig(class_name, sizeof(class_name), csig);
            // 把结果输出到output中
            snprintf(output, noutput, "%s::%s%s%s%s",
                     class_name, method_name, method_signature, source_info, annotation);

            deallocate(jvmti, (unsigned char *) csig);
        }
        deallocate(jvmti, (unsigned char *) method_name);
        deallocate(jvmti, (unsigned char *) msig);
    }
}
Todo:
对于DynamicCodeGenerated 还有另一种选项是展开内联优化的方法,这部分内容还需要后面继续探索。
结果
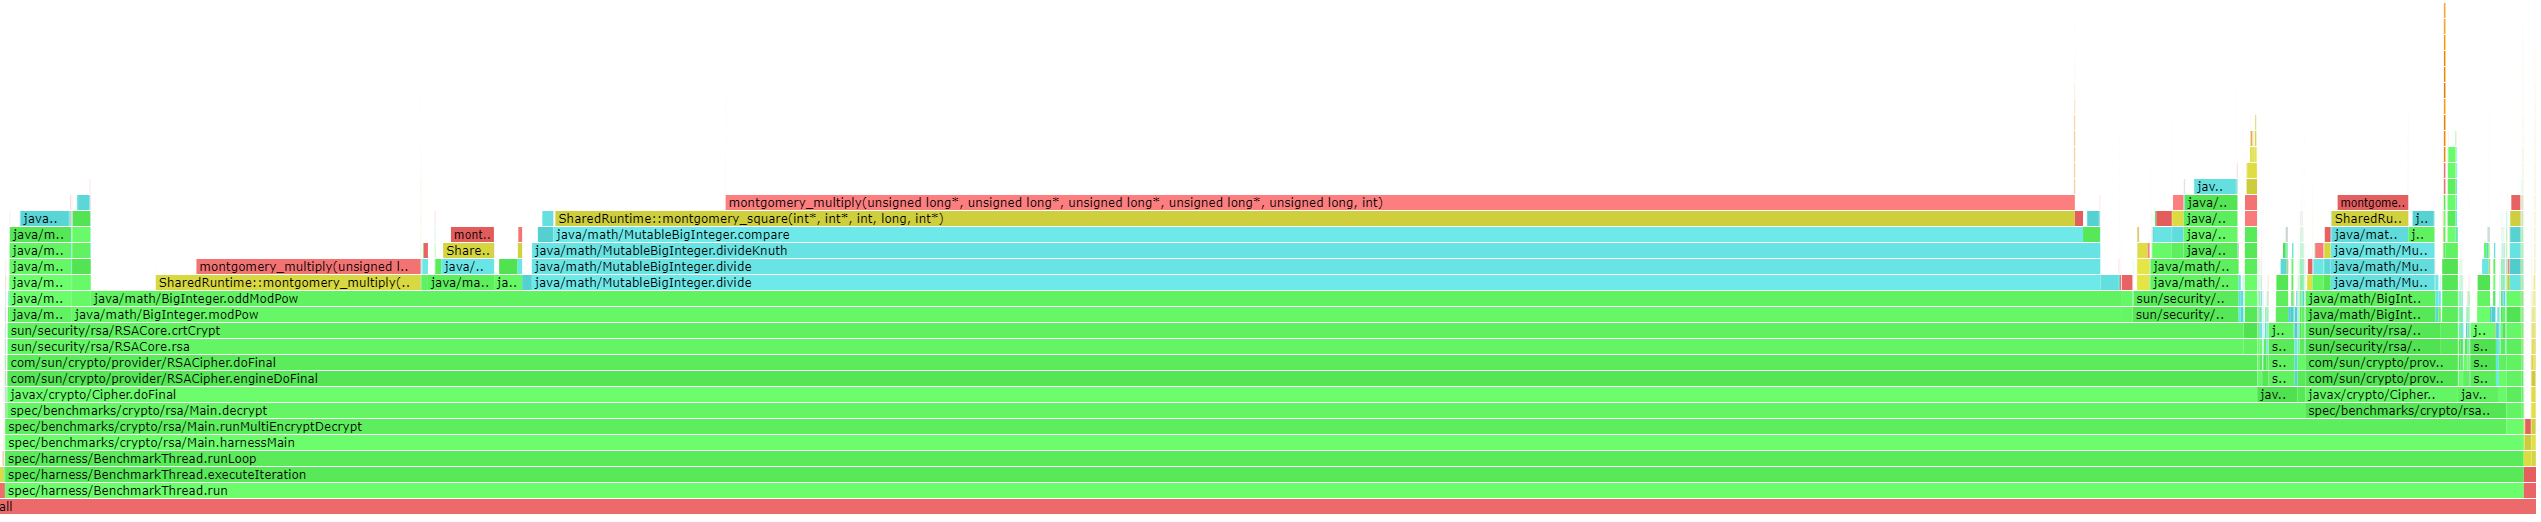
通过 perf-map-agent,我们生成的火焰图如下:
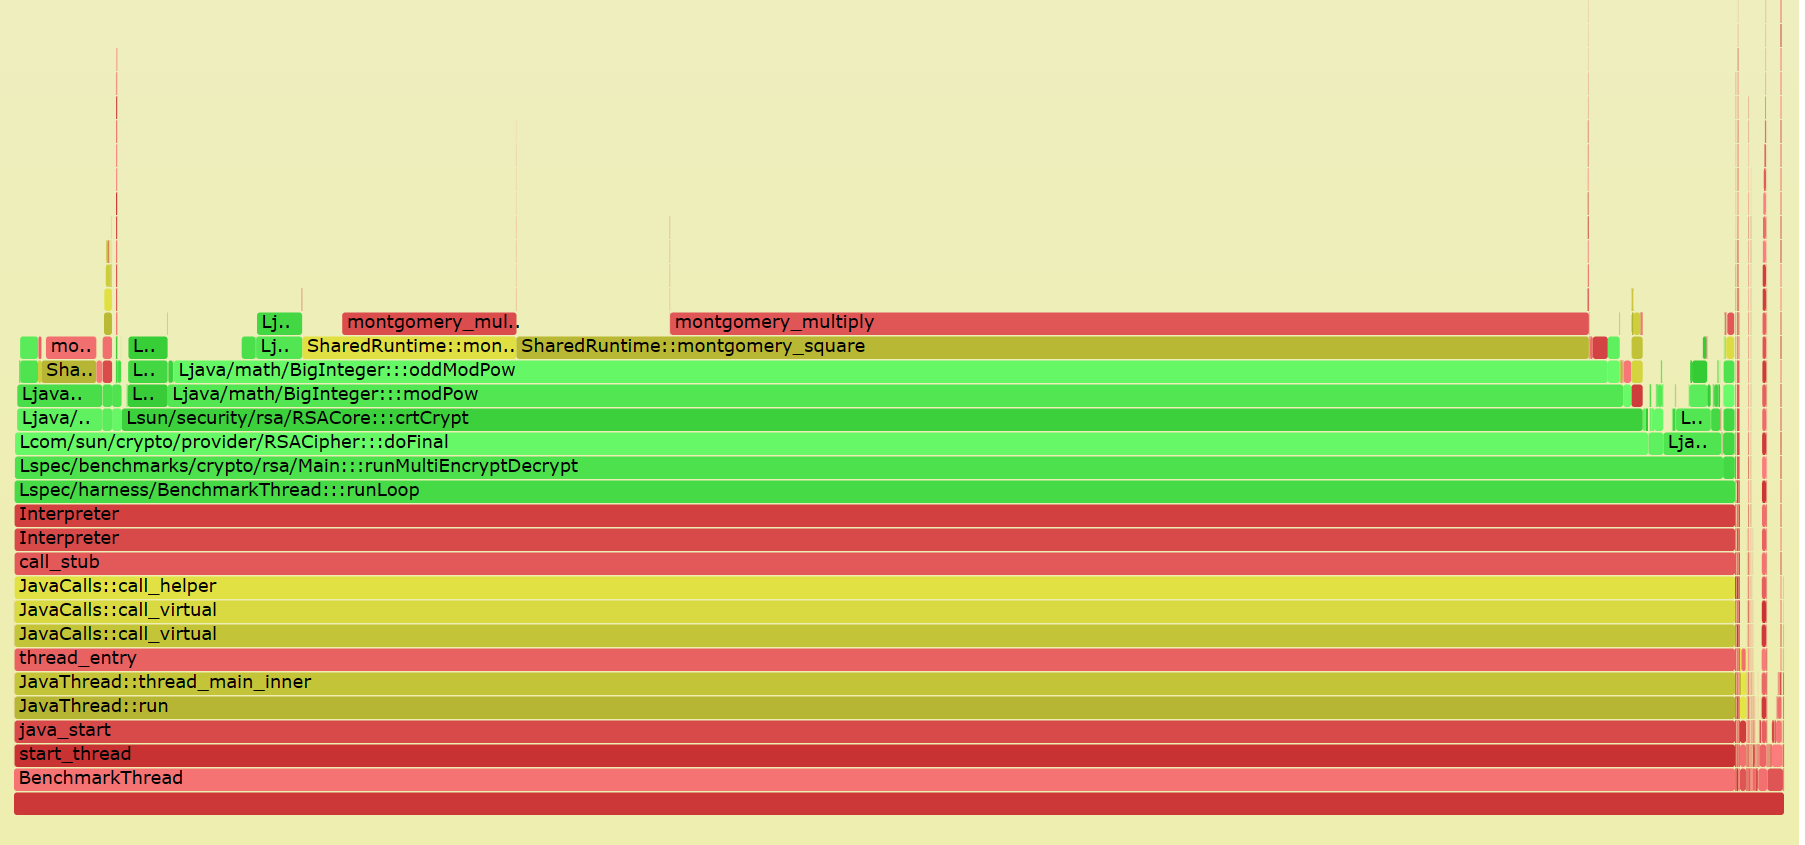
在FlameGraph项目下有一个jmaps脚本,通过perf-map-agent生成当前系统所有Java程序对应的map文件
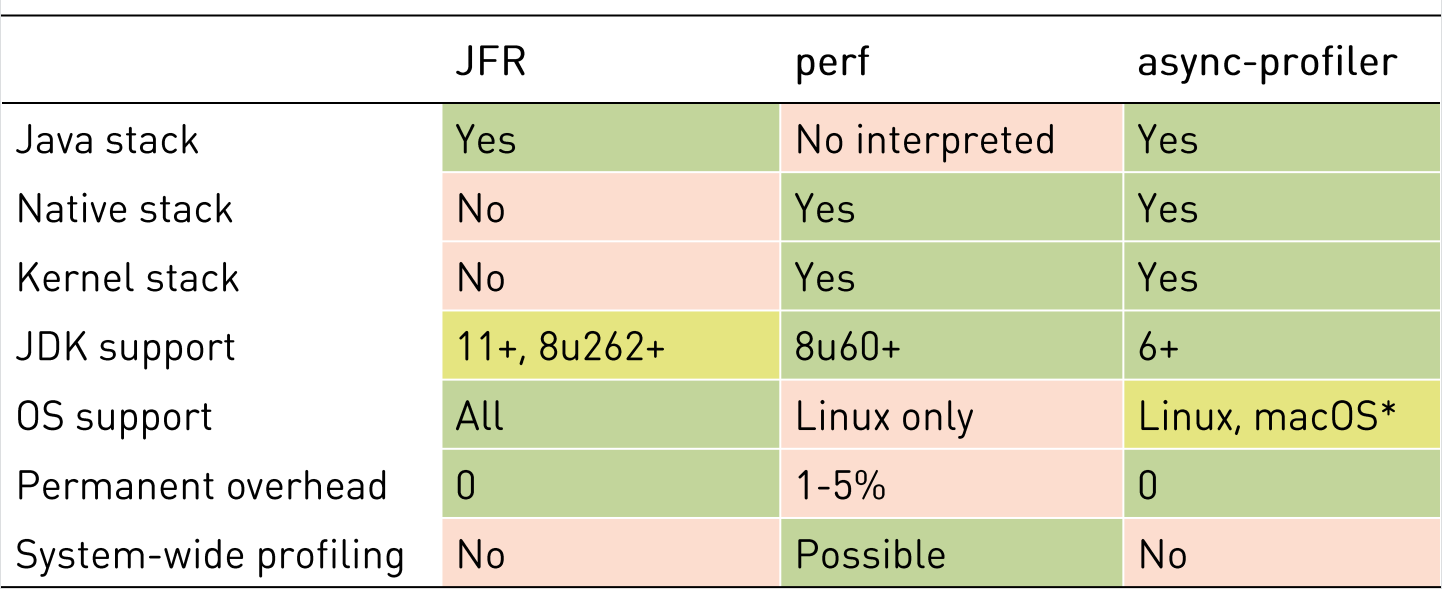
async-profiler
虽然 perf-map-agent 已经能够生成 Java 火焰图,但开启 PreserveFramePointer 会造成一定的性能损失。而 async-profiler(https://github.com/async-profiler/async-profiler)使用 AsyncGetCallTrace 实现了 stacks 的生成,性能影响很低。我们的性能损失对比如下:
| 项目 | ops/m | 下降 |
|---|---|---|
| Oracle JDK 8-371 compress | 700.6567 | |
| +PreserveFramePointer | 680.77 | 下降约 3% |
| +perf&Perf-map-agent | 651.64 | 下降约 7% |
| +perf&Perf-map-agen&+PreserveFramePointer | 637.19 | 下降约 9% |
| +async-profiler | 698.92 | 下降约 0.3% |
这里是作者给出的对比图(https://github.com/apangin/java-profiling-presentation/blob/master/presentation/java-profiling.pdf):
Todo:
在async-profiler中提到了它通过AsyncGetCallTrace可以避免Safepoint bias problem。后续需要明白 Safepoint bias problem,可以参考 http://psy-lob-saw.blogspot.com/2016/02/why-most-sampling-java-profilers-are.html
附录 Case
此前进行了一个简单的性能分析探索,可以查看 Perf&FlameGraph 的 3.2